Here you will learn about a coordinate plane, including the general form of a coordinate plane, plotting coordinates on different axes, and determining the coordinates of a point.
Students will first learn about coordinate planes as part of the number system in 6th grade.
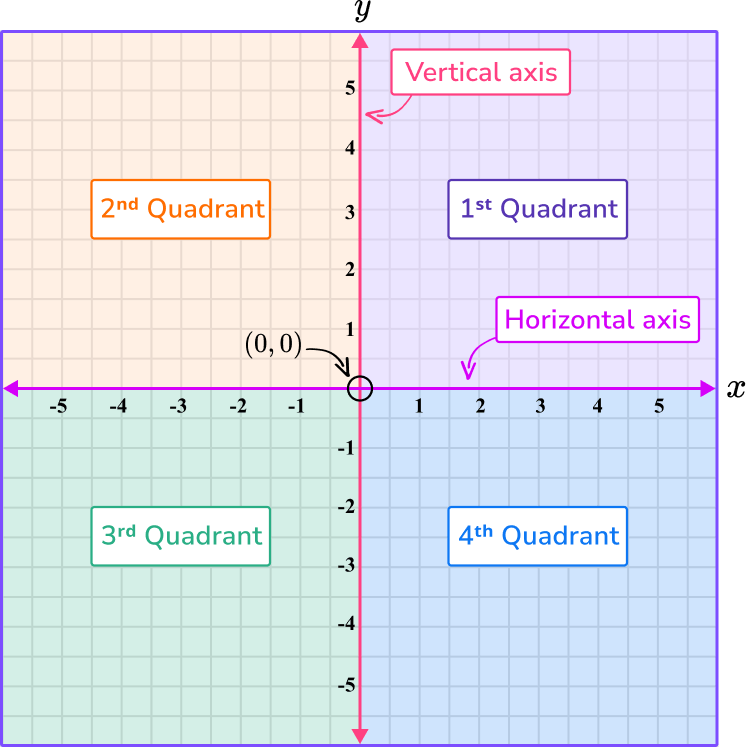
A coordinate plane is formed when a vertical number line overlaps a horizontal number line, forming a 2 dimensional gridded surface. It can also be called a coordinate grid.
The horizontal number line is called the \textbf -axis and the vertical number line is called the \textbf -axis. They intersect at the origin, (0,0).

In a coordinate plane there are four quadrants. The values on the x and y axes are different in each quadrant:
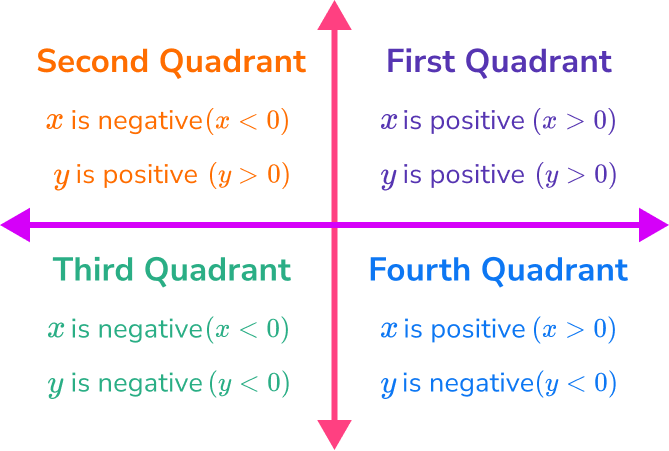
Note, it is also common for the names of the quadrants to be written with Roman numerals (I, II, III, IV).
Each axis has a scale. The scale must increase in equal amounts, but the scale does not have to be the same for both axes.
Here, both the x -axis and
the y -axis increase in
increments of 1.
Here, the x -axis increases
in equal steps of 2, and
the y -axis increases in
increments of 0.5.
Here, the x -axis increases
in equal steps of 0.25, and
the y -axis increases in
increments of 5.
Coordinates are used to determine location on the coordinate plane.
A coordinate is written as (x,y), where the value for the x -coordinate represents the horizontal position of the coordinate, the value for the y -coordinate represents the vertical position of the coordinate and they are enclosed with parentheses.
These can also be referred to as ordered pairs.
For example, the coordinate (3,5) has a horizontal position of 3, and a vertical position of 5.
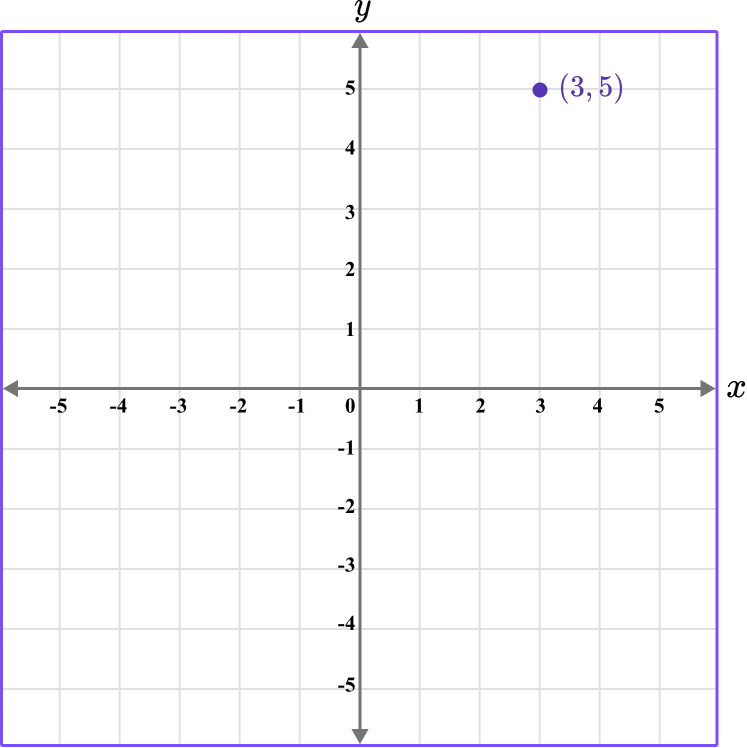
Besides locating the position of a coordinate, you can also plot coordinates within all four quadrants.
To do this, determine the horizontal and vertical position of the coordinate on the axes, and follow these values until the two values meet.
Draw the point A \, (4,2).
To draw the point, locate 4 on the x -axis, and then 2 on the y -axis. Follow the straight lines from these points to the coordinate A \, (4,2).
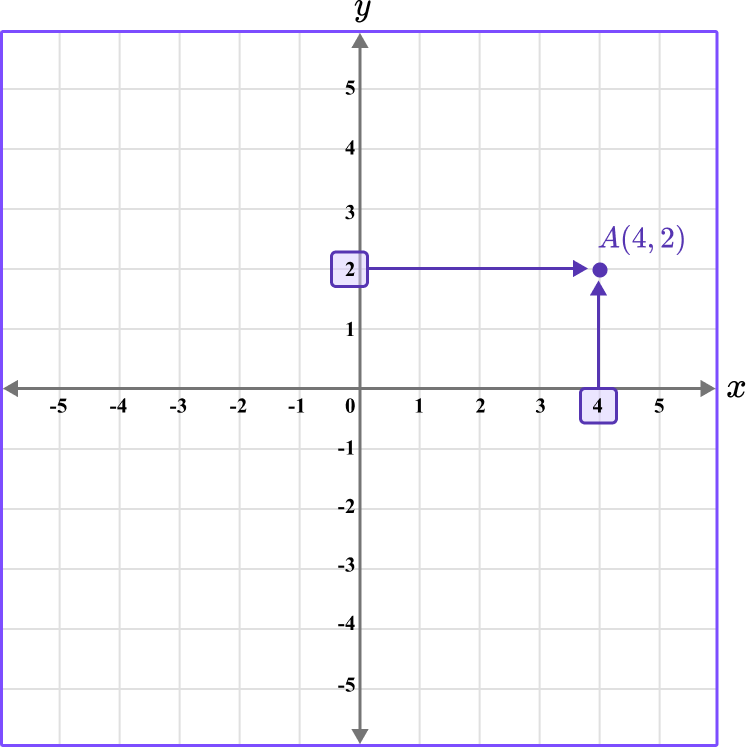
Note, to give a coordinate a specific name, label it as a point by using a capital letter.
Repeating this process by plotting points B \, (-4,4), \, C \, (-5,-3), and D \, (1,-2)…
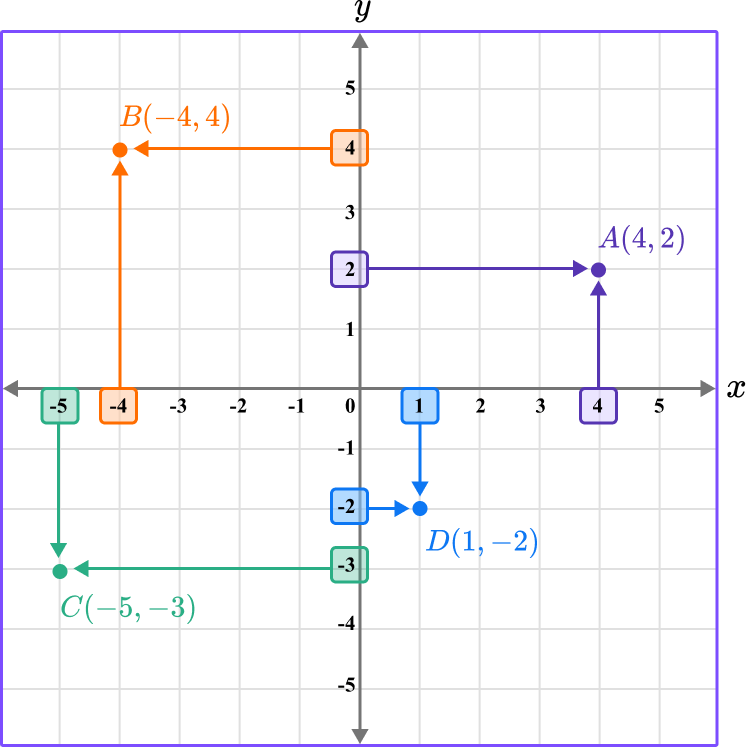
Note that coordinates can have decimal values. It is common to only see integer coordinates that lie on a grid line, however, you can also plot coordinates that have a decimal value, such as E \, (2.5, 3.5) and F \, (-3, 1.5).
These would lie within or on the edge of a grid square.